Benchmark Scores
After calibrating your baseline successfully, you will be able to access benchmark scores and the input parameters of the existing conditions.
Table of contents
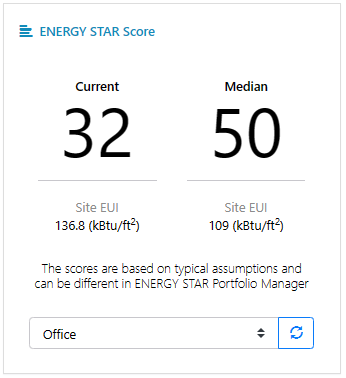
ENERGY STAR Score
The ENERGY STAR score provides a comprehensive snapshot of your building’s energy performance, taking into account the building’s physical assets, operations, and occupant behavior. It is expressed on an easy-to-understand 1 to 100 scale, where the higher the score, the better the energy performance of the building. It’ll help you identify which buildings in your portfolio to target for improvement or recognition.1 A score of 50 is the median. Lower is worse than average; higher is better.

To update the socre, select a occupancy type and click on the update button.
In Operation and Asset Scores
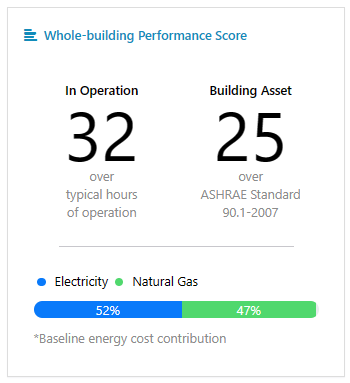
In Operation and asset scores can be understood as the ENERGY STAR score, where a lower score is worse than average and a higher score is better.

- In Operation Score - To determine an operation score, we compare a calibrated model to the same model but with typical building schedules. These schedules are based on ASHRAE standards. For example, suppose we have an office building. The baseline is established using the calibrated model and typical operating schedules from Monday to Friday, 8 am to 5 pm. If the calibrated building operates longer than the baseline, the in operation score would be lower than 50.
- Asset Score - Asset score is a metric that is similar to the miles-per-gallon (MPG) rating used for cars. It is based on a calibrated model and the building asset components required by ASHRAE Standard 90.1, which include roof and exterior wall insulations, windows U- and SHGC-values, and heating and cooling efficiencies. This model is known as an energy code baseline.
Note: The scores are calculated using a weather-normalized model by replacing the actual weather data with TMY3.
End-use Performance Score
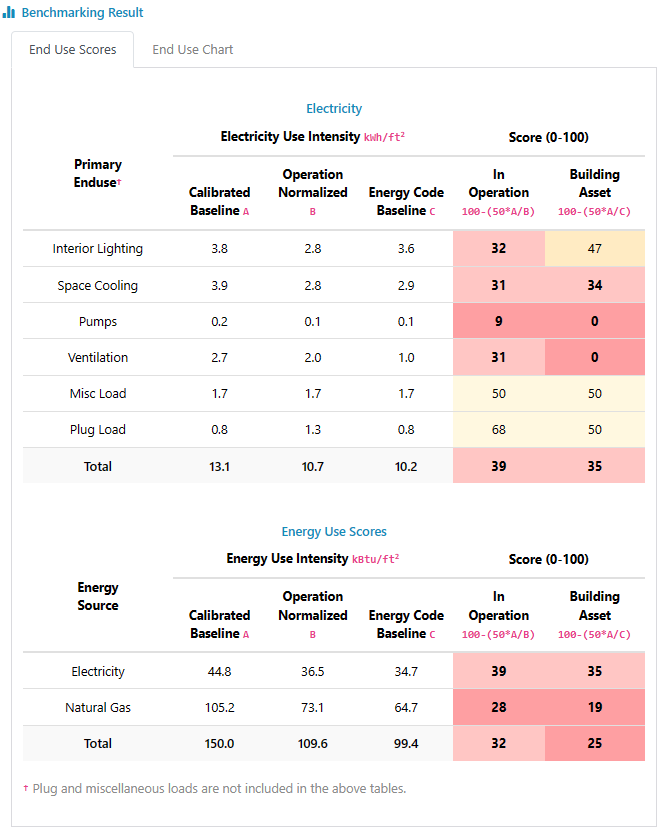
From the table, it is possible to check the potential savings from the red-marked end uses. In this example, the in operation score for interior lighting is low, indicating that around 50% of the lights are left on during unoccupied hours. Changing the lighting schedule presents a high potential for saving energy.

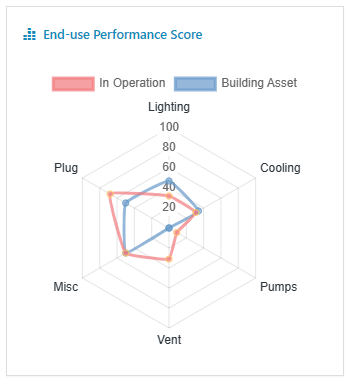
The in operation and asset end-use scores are plotted together.
