Frequently Asked Questions
Table of contents
How to understand the goodness of fit of a model?
If a model is calibrated within the threshold limits, it is considered to be sufficiently accurate in simulating the physical reality it is intended to represent. However, it’s important to note that these thresholds serve as a preliminary guide for the building calibration and should not be treated as absolute values. The statistical indices presented in this context are solely related to the predicted building energy consumption.
Hourly calibration
Threshold limits of statistical criteria for calibration
| Statistical Indices | ASHRAE Guideline 14 | IPMVP | FEMP |
|---|---|---|---|
| MBE [%] | ± 10 | ± 5 | ± 10 |
| CV(RMSE) [%] | 30 | 20 | 30 |
| CV(RMSE) | Less than 20% | Btn 20% and 30% | Greater than 30% |
|---|---|---|---|
| Calibration | Good-fitting | Acceptable | Not acceptable |
| Required procedure | Not required | Not required | Double-check meter data and user inputs and then re-run a calibration |
Monthly calibration
Threshold limits of statistical criteria for calibration
| Statistical Indices | ASHRAE Guideline 14 | IPMVP | FEMP |
|---|---|---|---|
| MBE [%] | ± 5 | ± 20 | ± 5 |
| CV(RMSE) [%] | 15 | - | 15 |
| CV(RMSE) | Less than 8% | Btwn 8% and 15% | Greater than 15% |
|---|---|---|---|
| Calibration | Good-fitting | Acceptable | Not acceptable |
| Required procedure | Not required | Not required | Double check meter data and user inputs and then re-run a calibration |
What is Remote Audit Assistance?
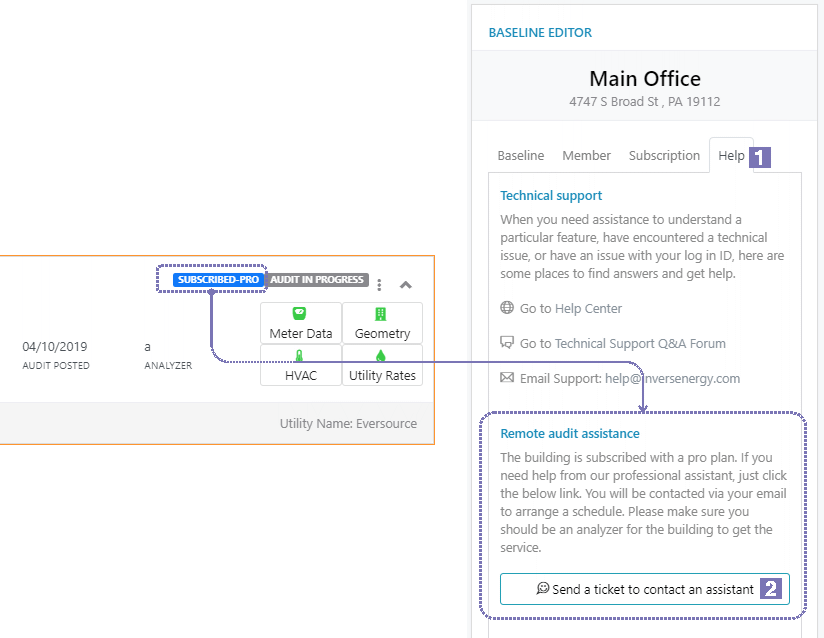
Remote Audit Assistance lets you audit your building with help from an online professional energy audit expert. It is useful for operation managers or energy consultants who may be unfamiliar with the InversEnergy platform but wants to perform an energy audit using the InversEnergy platform.
If your building is subscribed with a Business subscription,
- Remote Audit Assistance should already be activated.
- You can contact our professional auditor to arrange an online meeting by clicking the link in the menu (see below).

Understanding Performance Scoring
Calibrated Baseline Model
- What it is: A model based on actual weather data and measured energy usage.
- How it’s used: As a starting point for all other calculations.
Weather-Normalized Model
- What it is: The Calibrated Baseline Model adjusted with typical weather data (TMY3).
- How it’s used: For consistent energy analysis across different time periods.
Two Additional Models: Two Ways to Look at Performance
The “How You’re Operating” Model (Operation Normalized Baseline) Imagine if everyone in every building followed the same schedule and behaved the same way. That’s what this model does. It takes your building and applies standard operating schedules. This helps us see how much of your energy use is due to how the building is being operated, versus the building itself.
The “How Your Building is Built” Model (Energy Code Baseline) This one’s like asking, “What if your building was built to just meet current energy codes?” It helps us understand how the physical aspects of your building – its “bones” – contribute to its energy performance.
Both scores work on a scale where 100 is perfect (using no energy) and 50 means you’re using exactly as much as the baseline. The higher your score, the better you’re doing!
Operation Normalized Baseline Model
- Purpose: Calculates the “In Operation Score”
- How it’s created: Uses standardized schedules (ASHRAE) instead of actual operating conditions
- Formula:
In Operation Score = 100 - (50 x Calibrated Baseline EUI / Operation Normalized Baseline EUI)
Energy Code Baseline Model
- Purpose: Calculates the “Building Asset Score”
- How it’s created: Modifies input parameters to meet selected energy code requirements
- Formula:
Asset Score = 100 - (50 x Calibrated Baseline EUI / Energy Code Baseline EUI)
Calculating Energy Savings
For retrofit projects: Compare post-retrofit model (with proposed Energy Conservation Measures) to the Calibrated Baseline Model.
graph TD
    A["Weather-Normalized Calibrated Baseline"]
    A -->|"In Operation Score"| C["Operation Normalized Baseline"]
    A -->|"Asset Score"| D["Energy Code Baseline"]


    subgraph "Benchmarking Score"
        C
        D
    end

    style A fill:#ff9999,stroke:#333,stroke-width:2px

    style C fill:#f0f0f0,stroke:#333,stroke-width:2px
    style D fill:#f0f0f0,stroke:#333,stroke-width:2px
Simplified Explanation:
- We start with a model based on real data (Calibrated Baseline).
- We adjust this model for typical weather (Weather-Normalized).
- We create two more models from the model:
- One that uses standard operating schedules (for In Operation Score)
- One that meets energy code requirements (for Building Asset Score)
- We compare these models to see how well the building is performing:
- Against typical operations
- Against energy code standards
- The formulas give higher scores for buildings that use less energy compared to the baseline.
How to exclude outliers in my meter data?
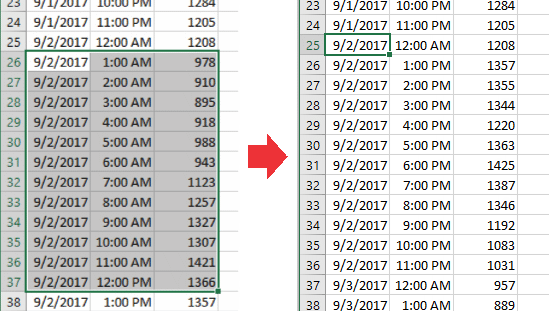
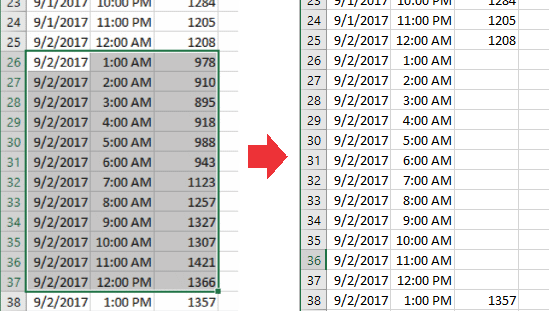
The quick answer is to treat them as missing data. The maximum amount of missing data allowed within our system is 2-month data points (1,440 hours). For some reason, a portion of the meter data is not representing actual energy consumption, you can exclude it using Excel or any text editor by:
- removing the entire row of the data including the dates, or
- either filling it with zeros or blanks along with the dates.
The examples shown below are all acceptable with a CSV (Comma-separated values) data file. For the Green Button data, you need to use an XML editor like Microsoft XML Notepad 2007.
 or
or  or
or 