Understand the benchmark
The Benchmark page shows how your calibrated baseline performs today and where its energy goes. It compares the building with a typical-operation version and a code-compliant version of the same building, so you can see which end uses to target and how much improvement is possible.
For: Everyone the baseline is shared withWhere: Analysis › Benchmark
The baseline is calibrated and pinned on the Home tab.
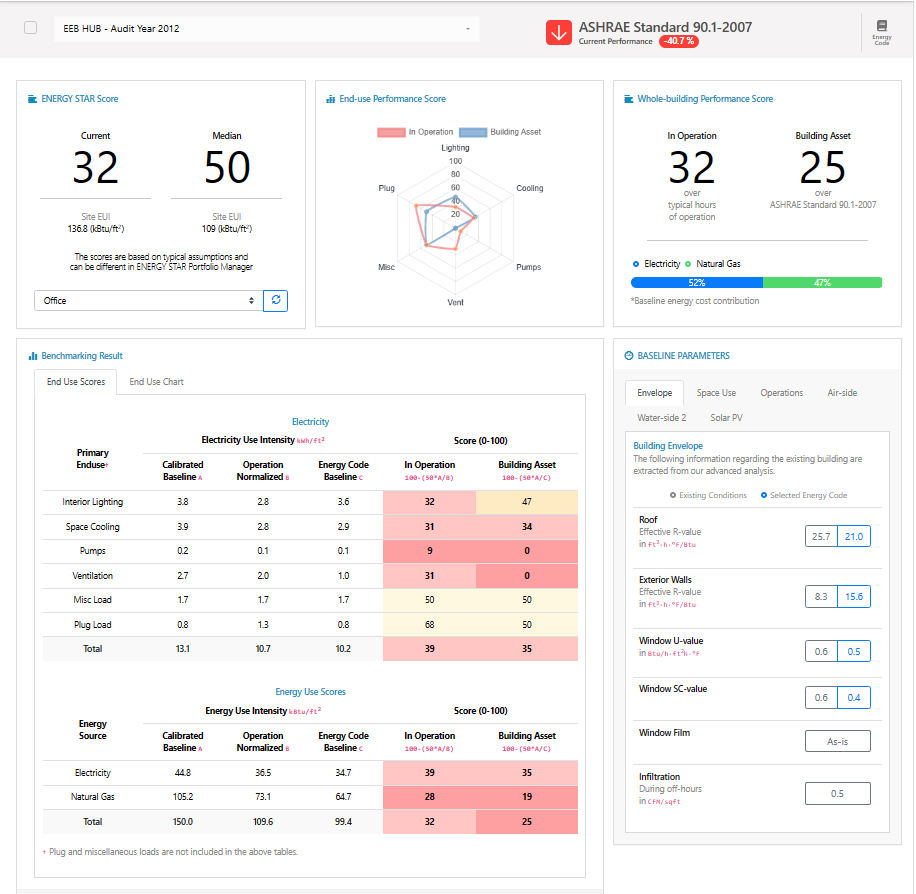
What’s on the page
Choose the baseline at the top of the page. Check the box next to it to open this baseline by default.
- Building facts and model fit - The building type, floor area, address, climate zone and audit year, and how closely the calibrated model matches your meter data. See Read the calibration results.
- ENERGY STAR® Score - Your building’s score next to the Portfolio Median, a score of 50. See Scores.
- Whole-Building Performance Score - The operational score and the asset score. See Scores.
- Current Performance vs. Energy Code - Your energy cost compared with a code-compliant version of the building, for the energy code you select. See Scores.
- End-Use Benchmarking - The site EUI of the three compared scenarios, the energy use gap by end use, the end-use score tables and two charts. See Scenarios and the energy use gap.
- Existing Building Parameters - The building conditions captured during the calibration, compared with the selected energy code. See Existing building parameters.
Most sections have an AI Insight or AI button that writes a short analysis of that section. See AI insights.
The building facts show the gross floor area you entered. If the modeled floor area (the footprint times the number of stories) is different, it is shown in parentheses. The EUIs on the Benchmark page use the modeled floor area.