Scenarios and the energy use gap
The End-Use Benchmarking panel shows how much energy your building uses above a code-compliant version of itself, and whether that comes from how it’s built or how it’s run.
For: Everyone with access to the baselineWhere: Analysis › Benchmark › End-Use Benchmarking
Compared scenarios
All benchmark results compare three versions of your building, all derived from the calibrated model:
| Scenario | What it is | |
|---|---|---|
A | Current Building Performance | Your building as it operates today |
B | Typical Operation Scenario | The same building with typical schedules and setpoints |
C | Code-Compliant Scenario | The same building built to the selected energy code |
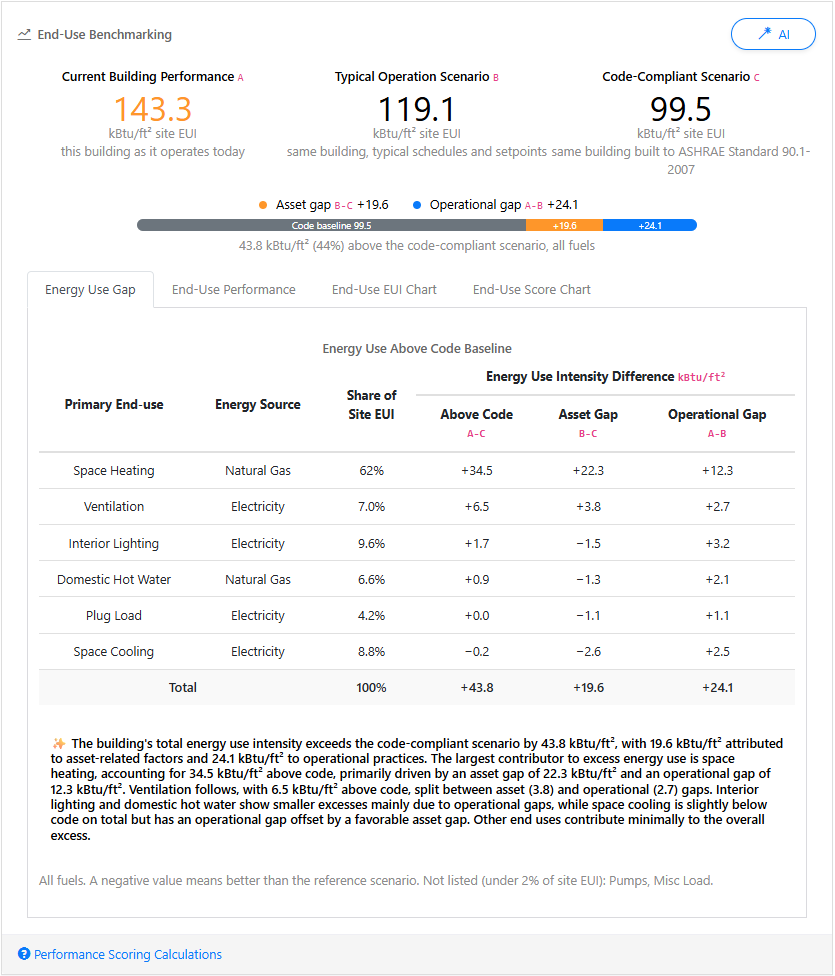
The top of the End-Use Benchmarking panel shows the site EUI of each scenario in kBtu/ft². The bar below splits your building’s site EUI into the code baseline and two gaps:
- Asset gap (
B - C, orange) - Energy used because of the building’s design, envelope and equipment. - Operational gap (
A - B, blue) - Energy used because of schedules, setpoints and operating practice.
Energy Use Gap
The Energy Use Gap tab breaks the gaps down by end use. For each end use it shows its share of the site EUI and how far it is above the code-compliant scenario (A - C). It then splits that into the asset gap and the operational gap. All fuels are shown in kBtu/ft². A negative value means better than the reference scenario. End uses below 2% of the site EUI are listed under the table instead of in it.
End-Use Performance
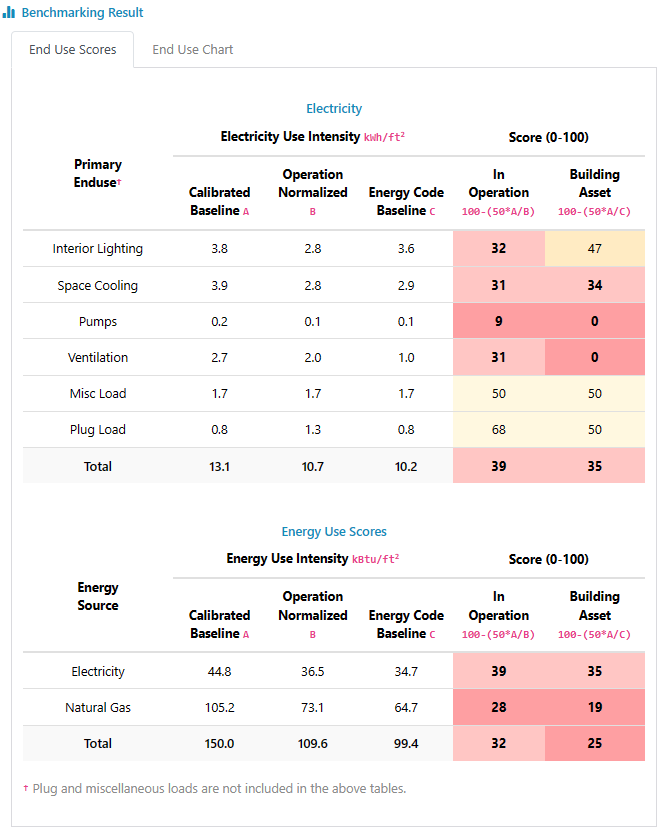
The End-Use Performance tab shows the EUI of each scenario and the operational and asset scores for each end use:
- Electricity - In kWh/ft².
- Other End Uses - Natural gas and other fuels, in kBtu/ft².
- Energy Use Scores - Totals by energy source, in kBtu/ft².
Score cells are shaded from red (low) to yellow. A dash (–) means there is no score because the reference scenario uses no energy for that end use.
In the example below, pumps, ventilation and interior lighting have low operational scores, which points to schedules and setpoints, such as fans and pumps running during unoccupied hours. Adjusting those schedules has a high potential for saving energy.
Charts
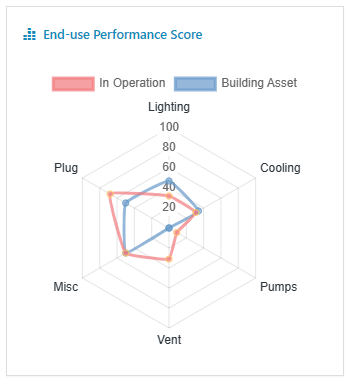
The End-Use EUI Chart tab compares the three scenarios for every end use. The End-Use Score Chart tab plots the operational and asset scores of each end use together.