Scores
What the ENERGY STAR, operational and asset scores and the energy cost comparison mean, and how to read them.
For: Everyone with access to the baselineWhere: Analysis › Benchmark
ENERGY STAR score
The ENERGY STAR score rates your building’s overall energy performance on a 1 to 100 scale, reflecting its physical assets, how it’s operated and how it’s used. A score of 50 is the median: lower is worse than similar buildings nationwide, and higher is better. It helps you decide which buildings to improve first.1
The card shows your building’s score and site EUI next to the portfolio median (a score of 50) and its site EUI. The site EUI uses the modeled floor area, so it matches the calibrated model. If the model changes, for example after you rerun the calibration, the score is recalculated the next time you open the page.
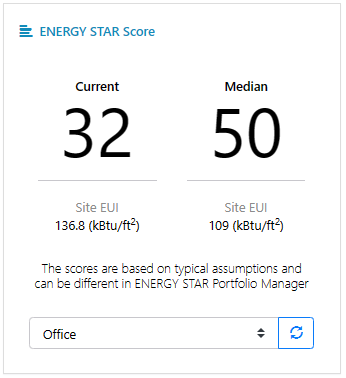
To calculate the score for a different property type, choose it under Select Building Type and click the refresh button next to it. Some building types aren’t covered by ENERGY STAR Portfolio Manager, and no score is shown for them.
Operational and asset scores
The operational score and the asset score work like the ENERGY STAR score: 50 means the same energy use as the reference, a lower score is worse, and a higher score is better. Both compare your building with a version of itself rather than with other buildings.
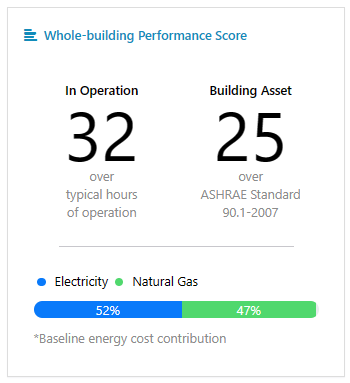
- Operational score - Compares the calibrated model with the same building run on typical schedules based on ASHRAE standards. For example, if an office building runs longer than the typical Monday to Friday, 8 am to 5 pm schedule, its operational score is lower than 50.
Operational score = 100 - 50 × A / B - Asset score - Similar to the miles-per-gallon (MPG) rating used for cars. It compares the calibrated model with the same building built to the selected energy code (ASHRAE Standard 90.1): roof and exterior wall insulation, window U-values and SHGC, and heating and cooling efficiencies.
Asset score = 100 - 50 × A / C
A, B and C are the three compared scenarios. Scores range from 0 to 100.
The scores are calculated with weather-normalized models, which use typical weather (TMY3) in place of the actual weather data. See How scores are calculated.
Energy cost vs. energy code
Current Performance vs. Energy Code shows how much higher or lower your building’s energy cost is than the code-compliant scenario, and how the current energy cost is split between energy sources.
To compare with a different code, click the energy code’s name and choose another one. The results are recalculated, which can take up to 10 seconds. The code currently in force in your state is tagged Current State Code. Only the baseline’s analyzer can change the code.